Law Firm Metrics: Essential KPIs That Drive Profitability and Growth
Updated November 2025 with expanded practice-specific benchmarks and actionable troubleshooting guidance
Most law firms track revenue. Far fewer track what matters.
A practice can bill $800,000 and barely break even. Another bills half that and takes home twice the profit. The difference: understanding law firm financial metrics that reveal whether your time converts into profit, whether your pricing holds, and whether your firm can sustain itself.
Why General Business Metrics Miss the Mark
Standard small-business accounting works for retail shops. It doesn't work for law firms.
Legal practices operate on billable time. You deal with trust accounts, contingency arrangements, and billing practices completely different from typical service businesses.
General metrics like "gross revenue" tell you nothing about whether you're pricing correctly, delegating efficiently, or collecting what you've earned. You need law firm financial metrics that show where profit comes from—and where it's disappearing.
Discover the metrics that separate real growth from surface-level gains in our Law Firm Growth: The Key Numbers That Reveal Whether Your Law Firm Is Really Growing.
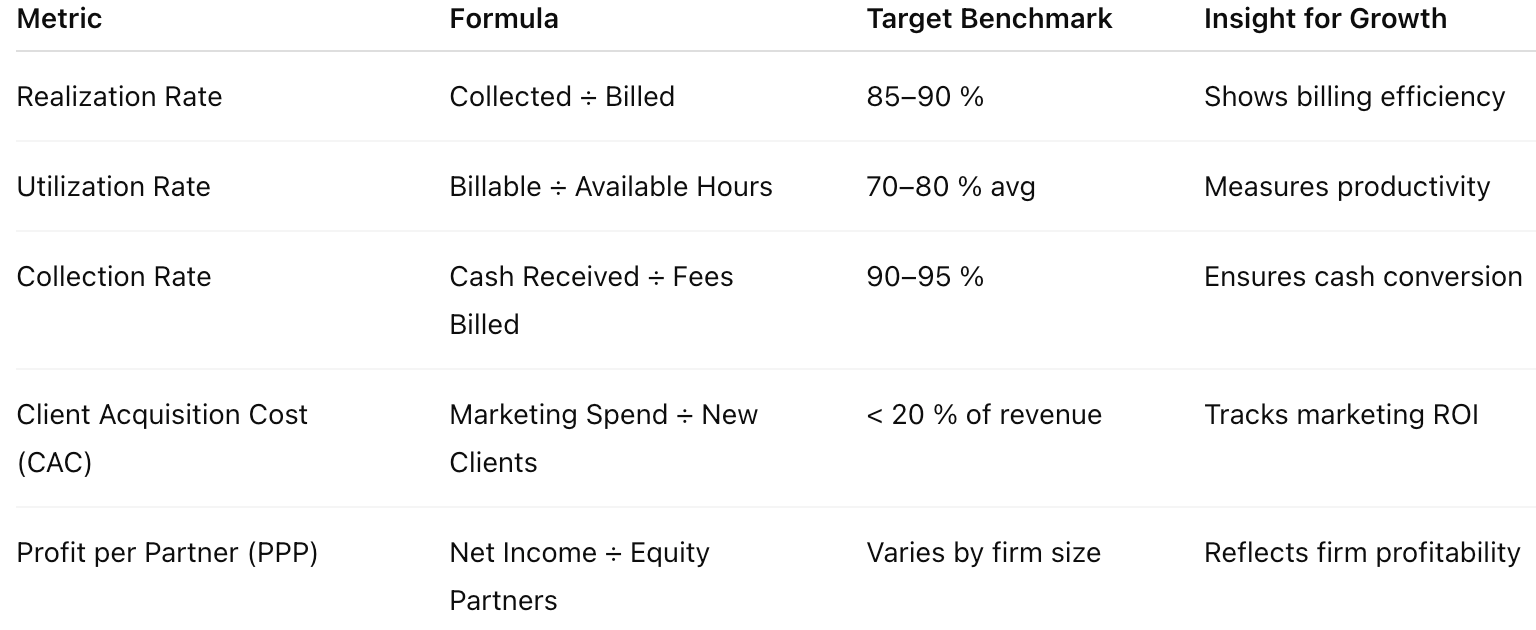
The Essential Law Firm Financial Metrics
Utilization Rate
What it measures: The percentage of available time spent on billable work.
Calculate by dividing billable hours by total available hours. If an attorney works 40 hours and bills 30, utilization is 75%.
Why it matters: Utilization reveals capacity. Low utilization means you're paying for time that doesn't generate revenue. Extremely high utilization signals burnout risk.
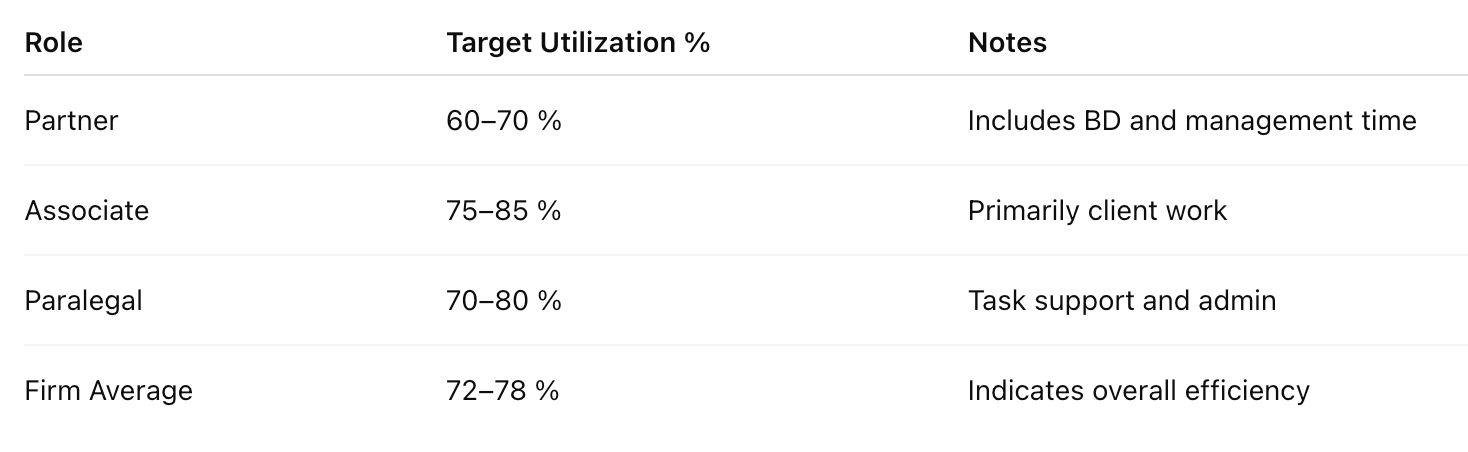
What healthy looks like:
Partners: 60–70%
Associates: 75–85%
Of counsel: 65–75%
These ranges account for business development and administrative work. Numbers consistently below these ranges indicate workflow or workload distribution problems.
Realization Rate
What it measures: The percentage of billed time that actually gets paid at full rate.
Calculate by dividing revenue collected by the total value of time billed at standard rates. If you bill $10,000 but collect $8,500 after discounts and write-offs, realization is 85%.
Why it matters: Realization is where profit disappears. You can work efficiently and bill promptly, but constant discounting or write-downs erode margins with every invoice.
What healthy looks like:
Target: 85–90%
Excellent: 90%+
Warning zone: Below 80%
Low realization usually stems from scope creep, unclear fee agreements, or hesitation to hold pricing boundaries. Every percentage point you improve directly increases profit without working another hour.
Learn how to identify the numbers that truly move the needle in our Law Firm KPIs vs. Financial Metrics: Understanding the Real Levers of Performance.

Effective Hourly Rate
What it measures: What you actually earn per hour after all adjustments.
Unlike your standard billing rate, your effective rate accounts for write-downs, discounts, and unbilled time. Calculate by dividing total revenue by total hours worked (not just billed).
If you bill at $350/hour but your effective rate is $240, you're leaving $110 per hour on the table.
Why it matters: This metric tells the truth about pricing. A high billing rate means nothing if half your work never converts to revenue.
What healthy looks like: Your effective rate should stay within 15–20% of your standard billing rate. Larger gaps indicate pricing or efficiency problems.
See which reports reveal your firm’s true financial health in our What Law Firm Financial Reports Should Actually Show.
Profit Per Matter
What it measures: Net income generated by each case after all costs.
Track revenue, direct costs (expert fees, filing costs), allocated overhead, and attorney time. What's left is actual profit.
Why it matters: Some cases consume enormous time while generating minimal profit. Without tracking profit per matter, you can't identify which work actually builds your firm.
What healthy looks like: This varies by practice area. The key is knowing your numbers. Track by matter type and use that data to guide which work you pursue.
Industry standards target collection rates between 90-95% within 120 days of billing.
Cash Runway
What it measures: How many months your firm can operate using current cash reserves.
Divide cash balance by average monthly operating expenses. If you have $60,000 and spend $20,000 monthly, you have three months of runway.
Why it matters: Revenue means nothing if you can't cover payroll next month. Cash runway gives you breathing room during slow periods and prevents panic-driven decisions.
What healthy looks like: Minimum three months. Comfortable is six months. Below two months means you're operating without a safety net.
Building cash reserves requires proper financial systems. Learn how to set up month-end routines, reconciliation processes, and reporting workflows in our complete guide to accounting for law firms.

Monthly Operating Margin
What it measures: The percentage of revenue remaining after covering all operating expenses.
Calculate by subtracting total monthly expenses from total revenue, then divide by revenue. If you bring in $50,000 and spend $35,000, your operating margin is 30%.
Why it matters: Operating margin shows whether your firm actually makes money or just moves it around. This tells you if your pricing, staffing, and overhead are sustainable.
What healthy looks like: Solo and small firms should target 25–35% operating margins. Below 20% means expenses are too high. Above 40% might indicate under-investment in growth.
Which Metrics Matter Most for Your Practice
Your practice type determines priorities.
Solo Practitioners: Focus on effective hourly rate (you have no leverage—every hour matters), cash runway (no partner to cover gaps—need 6 months minimum), and realization rate (every discount comes from your income).
Small Firms (2-5 Attorneys): Prioritize utilization rate (low utilization means you're subsidizing non-billable time), realization by attorney (track individually—one discounting partner can hide), and profit per matter (volume reveals which case types generate profit).
Contingency Practices: Cash runway first (need 12+ months for 6-18 month settlement cycles), profit per matter (case costs vary wildly), and case cycle time (directly affects cash flow projections).
Transactional Practices: Realization rate is critical (flat fees plus scope creep destroy margins), effective hourly rate (know your true return even with flat fees), and profit per matter type (different work has different profitability).
What to Do When Your Metrics Are Off
When Realization Drops Below 80%
Pull write-downs by matter for the last 90 days. Identify the pattern.
If scope creep: Revise engagement letters to specify scope. Add: "Work outside agreed scope billed at standard rates with written approval."
If client pushback: Send monthly billing summaries before invoices showing work completed and value delivered.
If partner discounting: Require written justification for discounts above 10%. Make realization part of partner compensation.
When Utilization Falls Below Target
For associates: Implement weekly work allocation meetings. Review capacity and redistribute matters each Monday.
For partners: Pull non-billable time reports. If 20+ hours weekly go to admin, delegate.
When Cash Runway Drops Below 3 Months
This week: Call clients with 60+ day invoices. Send retainer requests for all new matters (25-50% of estimated fees). Pause discretionary spending.
This month: Add ACH/credit card payment options. Establish a line of credit while financials look good.
Long-term: Set aside 10% of each payment until you hit 6 months of reserves.
When Operating Margin Falls Below 20%
Pull your P&L. Compare to last year same period.
If revenue dropped: Check realization and utilization first - margins usually stem from revenue leakage or excess capacity.
If expenses increased: Audit subscriptions. Most firms have $500-2,000/month in forgotten tools. Calculate revenue per employee—if it dropped 20%+, you may have hired ahead of growth.
How These Metrics Work Together: A Real Example
Miller & Associates: Three-attorney estate planning firm. Annual revenue $675,000. Net profit $135,000 (20% margin). Partners splitting $67,500 each.
The metrics revealed the truth:
Associate utilization: 52% (should be 75%+) — costing $48,000 in lost revenue annually
Partner B realization: 76% (should be 85%+) — leaving $117,000 on the table through excessive discounting
Cash runway: 2.1 months (should be 6+) — creating constant stress despite decent revenue
Operating margin: 20% (should be 25-35%)
The fix:
Shifted estate administration work to the associate (utilization jumped to 71%). Partner B implemented fixed-fee pricing with clear add-ons, eliminating ad-hoc discounts (realization improved to 84%). Required 50% retainers on all new matters (cash runway reached 4.2 months).
One year later: Revenue $742,000 (+10%), operating margin 28%, partner distributions $103,000 each (+53%), cash runway 5.1 months.
Same firm. Same staff. Same office. The only change: tracking the right metrics and acting on what they revealed.
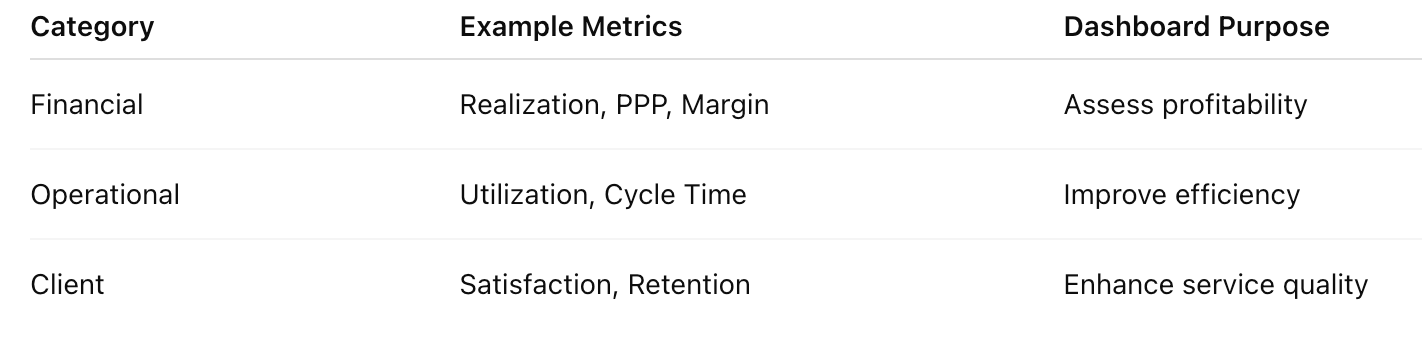
How These Metrics Guide Better Decisions
These metrics aren't just scorecards—they're decision tools.
Utilization above 85% consistently signals it's time to hire. Below 65% means adding staff spreads work thinner. Profit per matter shows where to focus development. A 30% gap between effective and standard rates reveals pricing problems, not market problems. Shrinking runway triggers collection focus and spending discipline.
The key: These metrics let you manage proactively instead of reacting to problems months after they start.
A Simple Monthly Metrics Routine
First week of each month:
Pull utilization rates — Clio: Reports > Productivity > Utilization Rate. MyCase: Analytics > Time Entry Report. Most systems track billable vs. non-billable automatically.
Calculate realization rate — Formula: Cash collected ÷ Value of time billed at standard rates. If you collected $45,000 but billed $50,000, realization is 90%.
Review cash runway — Operating account balance ÷ average monthly expenses. Track in a simple spreadsheet: Date | Balance | Expenses | Runway.
Check operating margin — Pull your P&L. Formula: (Revenue - Expenses) ÷ Revenue. Compare to your 25-35% target.
Once per quarter:
Review profit per matter — Group by practice area. Calculate: Revenue - Direct Costs - (Time × Effective Rate) = Profit.
Compare effective to standard rates — Total revenue ÷ Total hours worked = Effective rate. Gaps over 20% require investigation.
Analyze trends — Plot your six metrics across the quarter. Look for patterns.
Time investment: 60-90 minutes monthly. Most practice management software generates these automatically. The cost of law firm bookkeeping services with proper reporting pays for itself within the first quarter through improved collections.
For a deeper look at what your reports should reveal, explore what law firm financial reports should show.
Common Mistakes When Tracking Metrics
Tracking too many numbers. Focus on the six core metrics before expanding. More data doesn't mean more insight.
Comparing to irrelevant benchmarks. A solo estate attorney shouldn't measure against BigLaw rates. Find benchmarks within your practice area and size.
Measuring without acting. Every metric should connect to a decision you're willing to make. Tracking realization without addressing why it's declining wastes time.
Ignoring trust accounting. Revenue isn't yours until it clears trust. Proper trust accounting and IOLTA compliance is essential for accurate metrics.
Focusing only on revenue. A firm billing $1M with 15% margins takes home far less than one billing $600K with 35% margins.
Want to see exactly what your firm should be investing in monthly bookkeeping—and what you may be missing entirely? Read our Law Firm Bookkeeping Services: What Your Firm Needs for Compliance, Financial Clarity, and Growth.

Explore the foundational elements that keep top-performing firms profitable in our Key Components of Law Firm Financial Management.

Tracking these metrics is only half the equation. The other half is having accounting systems that generate accurate data automatically. Our accounting for law firms guide shows you how to set up the monthly routines, reconciliation processes, and reporting systems that make metric tracking effortless.
Let's Talk Numbers
Most solo and small-firm attorneys never received training in financial management. You learned how to practice law, not how to run a profitable business.
The difference between a practice that pays the bills and one that builds wealth comes down to two things: tracking the right metrics and having systems that make tracking effortless.
This post showed you what to track and why it matters. The Monthly Financial Playbook shows you how to implement these systems step-by-step—from setting up your chart of accounts to creating reports you'll actually use to making metric tracking part of your monthly routine.
We set up accounting systems specifically for law firms. We implement the reporting that shows these six metrics automatically. We help you interpret what the numbers mean for your practice and what to do when they're off track.
Most importantly, we ensure your trust accounting and IOLTA compliance is airtight—because metrics built on sloppy bookkeeping are worse than no metrics at all.
When you're ready to stop guessing and start knowing whether your firm is actually profitable—let's talk.
Book a consultation today and get a financial infrastructure that protects your margins, supports compliance, and actually fuels growth.
Frequently Asked Questions
-
Monthly for utilization, realization, and cash runway. Quarterly for profit per matter and trend analysis. Weekly if cash runway falls below three months. Consistency matters more than frequency-sporadic tracking creates blind spots.
-
Effective hourly rate. This reveals what you actually earn after discounts, write-offs, and unbilled time. A solo billing at $300/hour with a $200 effective rate is functionally a $200/hour attorney working harder than necessary.
-
Target 85-90% for most practices. Above 90% indicates strong pricing discipline. Below 80% signals problems with scope management, pricing, or billing practices. Contingency practices track settlement recovery rates instead.
-
Yes. Better realization earns more from existing work. Improved collections convert billings to cash faster. Most improvement comes from systems and pricing discipline, not grinding more hours.
-
Yes. Contingency requires tracking case cycle time, settlement rates, and cost-to-resolution in addition to standard metrics. Cash runway needs 9-12 months versus 3-6 for hourly firms. Mixed practices need separate tracking for each revenue model.
-
Total revenue ÷ Total hours worked (all hours, not just billable). If you earned $180,000 and worked 2,000 hours, your effective rate is $90/hour. Compare to your standard rate—the gap shows value lost to inefficiency or discounting.