Law Firm Financial Benchmarks: The Complete Reference Guide
Updated December 2025
Most law firm owners operate blind.
They know their bank balance. They know if last month felt busy. But ask them how their utilization rate compares to industry average, or whether their overhead ratio signals a problem, and you get silence.
That silence costs money. Without benchmarks, you can't identify whether your 32% profit margin represents solid performance or leaves 10% on the table. You don't know if your 85% collection rate needs attention or exceeds your peers. You're guessing.
This guide provides the actual numbers. Every benchmark draws from current industry data - Clio's Legal Trends Report, ABA studies, and aggregated firm performance metrics. Use it to measure where you stand and identify where you're leaving profit behind.
The Core Law Firm KPIs: Utilization, Realization, Collection
Three metrics form the foundation of law firm financial performance. They compound together to determine how much of your working time actually converts to collected revenue.
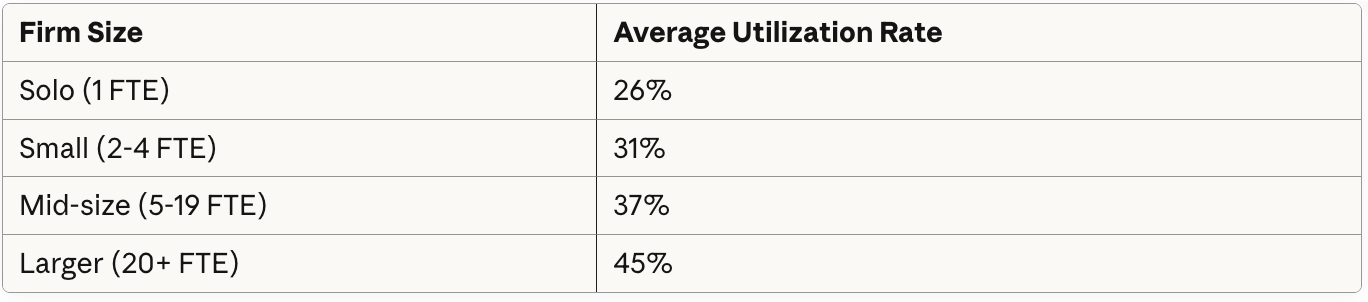
Utilization Rate
Utilization measures what percentage of an 8-hour workday goes to billable work.
Industry Average: 37%
That translates to 2.9 billable hours per 8-hour day. The other 5+ hours go to administration, business development, firm management, and non-billable client service.
Source: Clio Legal Trends Report
What the data reveals: Larger firms don't succeed because their attorneys work harder. They succeed because they've built systems protecting billable time. A solo at 26% utilization captures 2.1 billable hours daily. An attorney at a 20+ person firm captures 3.6 hours - 71% more billable time from the same workday.
Target: 40-45% utilization. Moving from 37% to 45% represents a 22% increase in billable capacity without adding hours to your day.
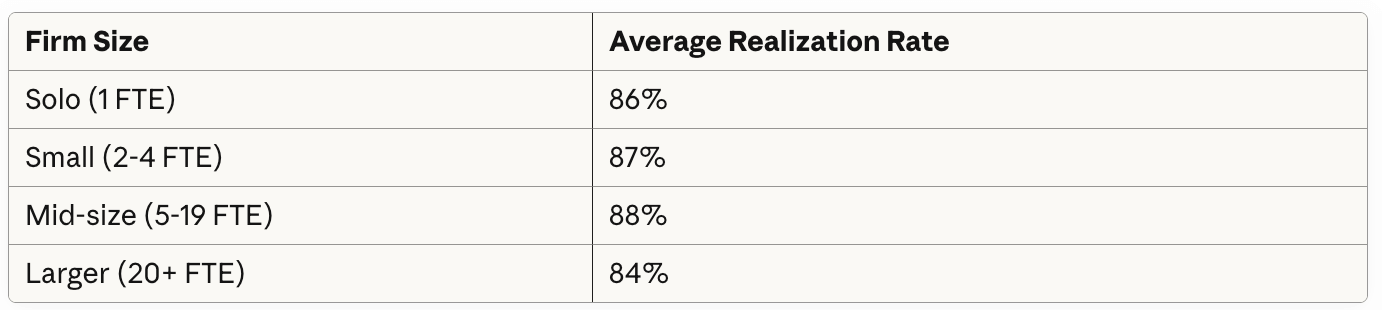
Realization Rate
Realization measures what percentage of billable work actually gets invoiced. The gap represents write-offs, write-downs, forgotten entries, and courtesy discounts.
Industry Average: 88%
Source: Clio Legal Trends Report
What the data reveals: Larger firms actually show lower realization - they write off more time. This often reflects billing guideline pressures from institutional clients or over-staffing on matters. Small firms have tighter margins for error and bill more aggressively.
Target: 90-95% realization. Track realization at the matter and attorney level. Investigate anything below 85%.
Collection Rate
Collection measures what percentage of invoiced work converts to actual payment.
Industry Average: 91%
The 9% gap represents invoices that never get paid - whether written off, disputed, or stuck in perpetual aging.

Source: Clio Legal Trends Report
What the data reveals: Smaller firms actually collect better than larger ones. Solo and small firm attorneys often have closer client relationships and more direct follow-up on receivables. Larger firms face institutional payment delays and more complex billing disputes.
Target: 95%+ collection rate. Monitor AR aging weekly, not monthly.
If your firm lacks the infrastructure to track these benchmarks consistently, our law firm bookkeeping services can build the reporting foundation you need.
The Compound Effect: Your Effective Rate
Here's the insight most firms miss. These three rates multiply together to determine your "effective rate" - how much of your working time actually produces collected revenue.
Industry Average Calculation:
37% utilization × 88% realization × 91% collection = 29.6%
That means the average attorney converts less than 30% of their working hours into collected fees. In an 8-hour day, only 2.4 hours generate actual revenue.
Top Performer Calculation:
45% utilization × 95% realization × 97% collection = 41.5%
Top performers convert 40%+ of working time to revenue - nearly 50% more efficient than average.
The gap between 29.6% and 41.5% on a $300/hour rate over 2,000 annual working hours:
Average: 2,000 × 29.6% × $300 = $177,600
Top performer: 2,000 × 41.5% × $300 = $249,000
$71,400 difference per attorney, per year - from the same hours worked.
Profit Margin Benchmarks
Profit margin measures what percentage of revenue remains after all expenses. For law firms, this typically represents owner/partner earnings. Benchmarks tell you where you stand - but you need a system for ongoing law firm KPI tracking to catch problems before they show up in quarterly numbers.
By Firm Size
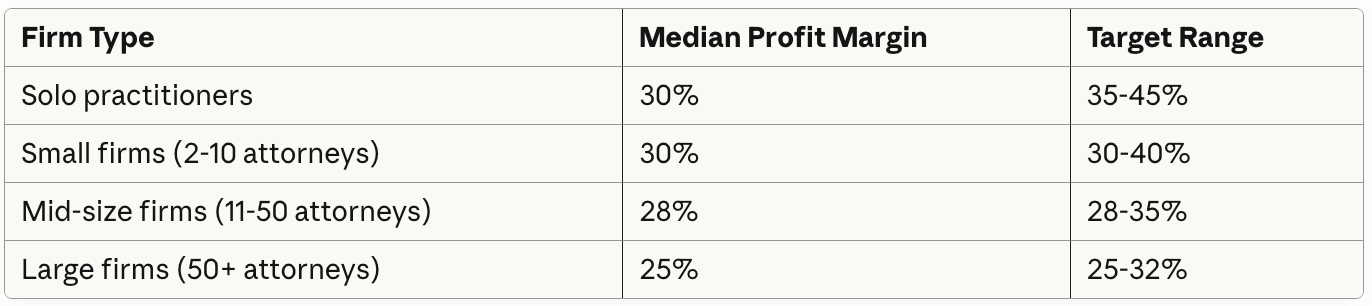
Source: ABA and industry surveys
What the data reveals: Smaller doesn't mean less profitable. Solo practitioners can achieve higher margins because they carry minimal overhead and take no profit-sharing dilution. The challenge is revenue ceiling - solo attorneys spend only 55% of their day on billable work versus 69% for attorneys at larger firms.
Strong benchmarks don't guarantee liquidity. Pair this data with a disciplined approach to law firm cash flow management to ensure profitability translates to actual cash in your operating account.
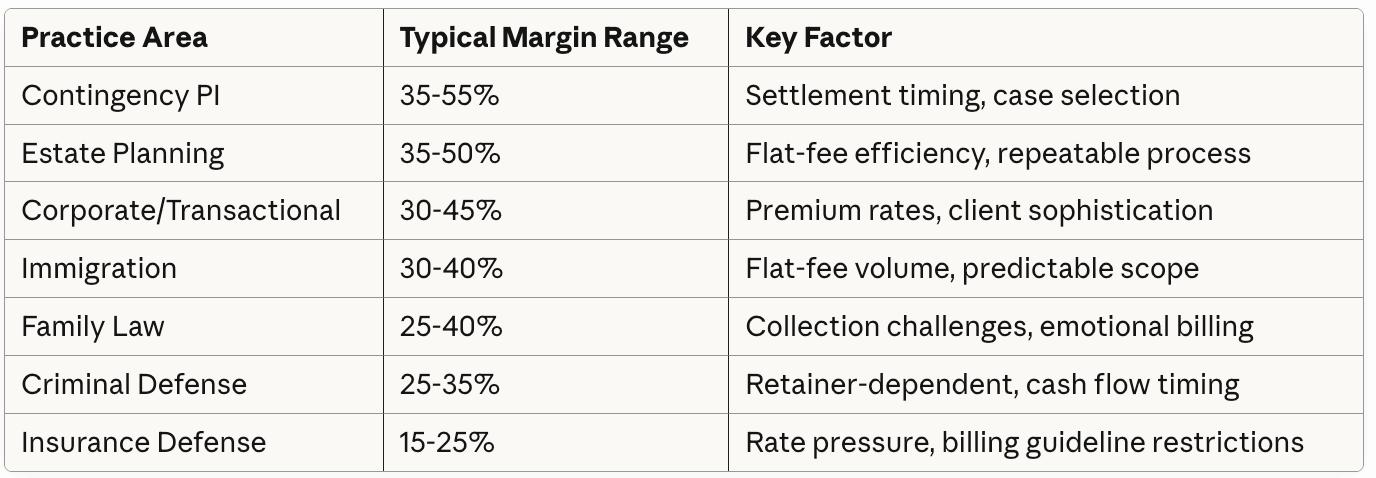
By Practice Area
Practice area dramatically affects margin potential due to billing model differences, client payment behavior, and matter complexity.
Target: 35-45% profit margin for well-managed small and mid-size firms. Exceptional performers reach 50%.
The "Rule of Thirds" Framework
A traditional benchmark for law firm financial allocation:
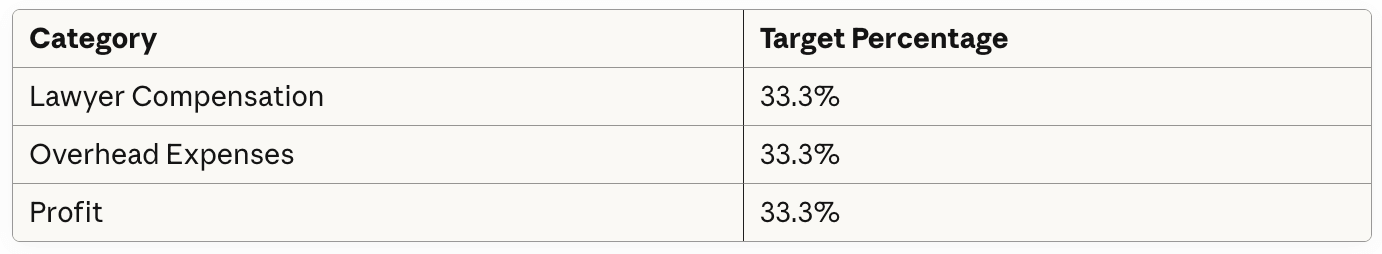
This framework suggests a baseline 33% profit margin is achievable with disciplined expense management. Firms exceeding this typically do so by compressing overhead below 33% rather than reducing compensation.
Revenue Benchmarks
Revenue Per Lawyer (RPL)
Revenue per lawyer measures firm efficiency in generating income from attorney resources.
Small Firm Target: 2-3× average attorney salary
Using Bureau of Labor Statistics data showing average lawyer salary around $176,000, small firms should target:

Am Law 100 Comparison: The largest 100 firms average approximately $1.16 million RPL, with top performers like Wachtell exceeding $3.8 million. These numbers aren't comparable to small firm operations but illustrate what's possible with institutional clients and premium positioning.
Revenue Per Employee
This broader metric includes all staff - attorneys, paralegals, and administrative support.
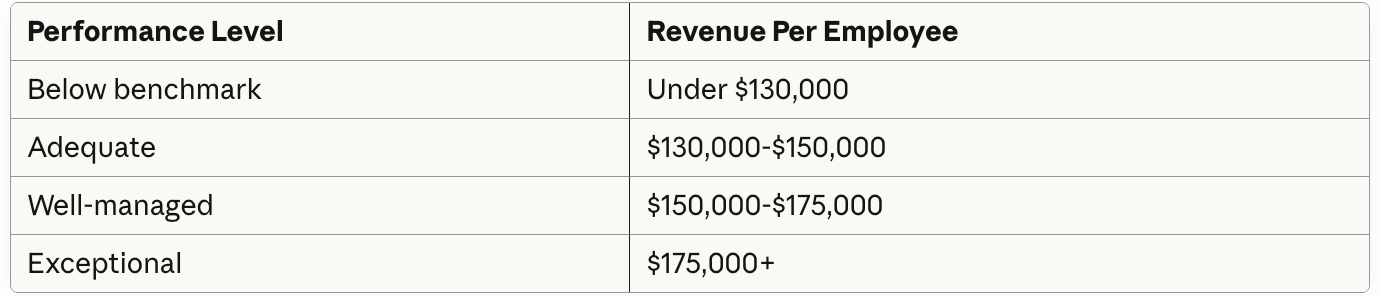
Firms below $130,000 per employee typically face overstaffing, inefficient systems, or pricing problems. This metric helps identify when headcount has outpaced revenue growth.
Overhead Benchmarks
Overhead encompasses all non-attorney expenses required to operate the firm. Industry data indicates law firms typically spend 45-50% of revenue on overhead.
Total Overhead Ratio
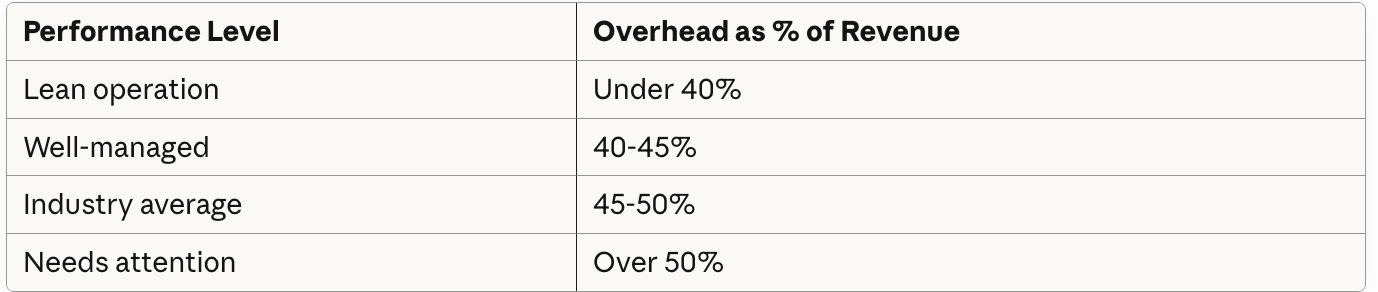
The profit connection: If overhead consumes 50% and attorney compensation takes 30%, only 20% remains as profit. Compressing overhead to 40% while maintaining compensation creates a 30% margin - a 50% improvement in profitability.
Overhead Category Breakdown
Where does overhead typically go? Benchmark percentages as proportion of total overhead (not revenue):

Red flags to watch:
Rent exceeding 25% of overhead in a market where remote work is viable
Technology under 8% - usually indicates underinvestment affecting efficiency
Marketing over 15% without corresponding client acquisition metrics
"Other" category growing without explanation
Overhead Per Attorney
Another way to view overhead: what does it cost to support each attorney?
Calculate by dividing total overhead by number of attorneys. Compare year-over-year to identify creep.
Warning sign: Overhead per attorney growing faster than revenue per attorney indicates margin compression.
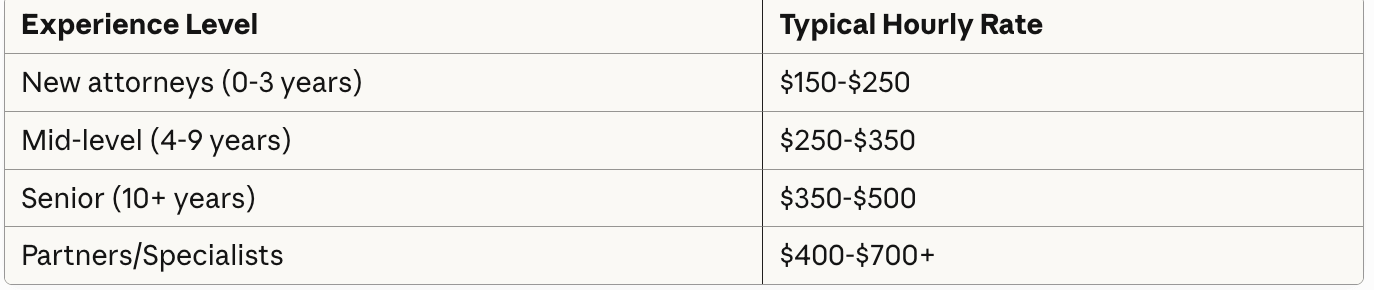
Billing Rate Benchmarks
What attorneys charge varies dramatically by geography, practice area, and experience.
By Experience Level
Geographic Variation
Billing rates vary by nearly 3× between highest and lowest markets:
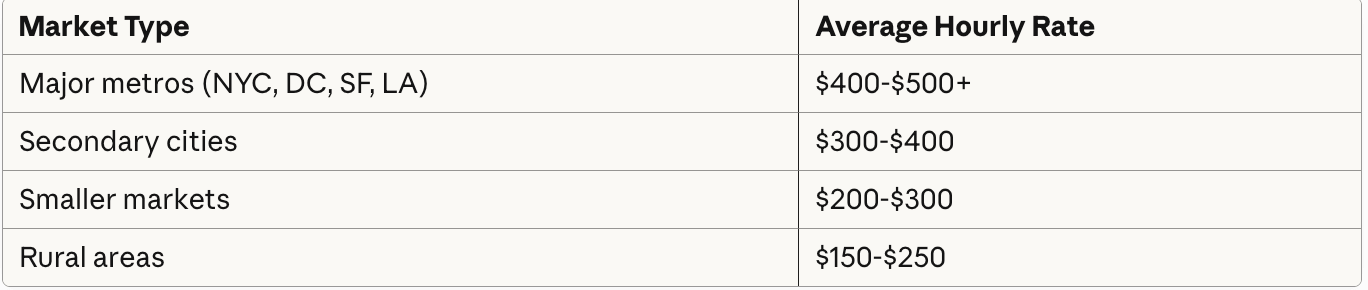
Source: Clio Legal Trends Report
By Practice Area
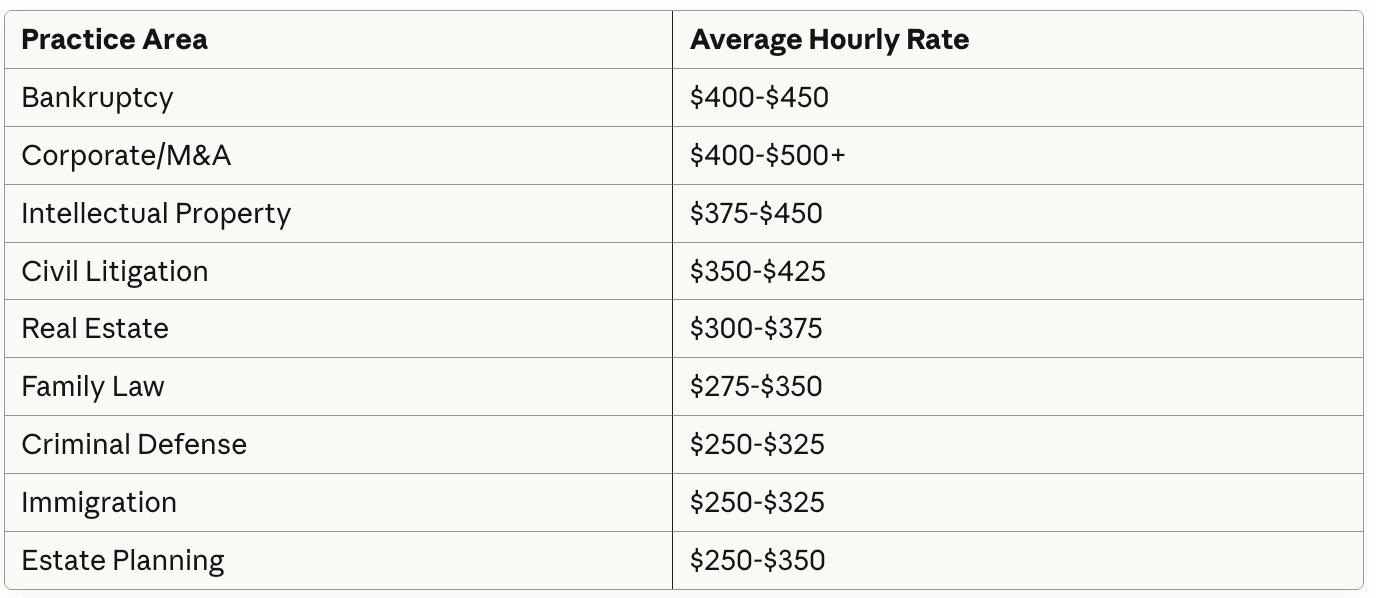
Context matters: Higher rates don't automatically mean higher profit. A $500/hour corporate practice with 15% margin generates less profit per hour than a $300/hour practice running 40% margin.
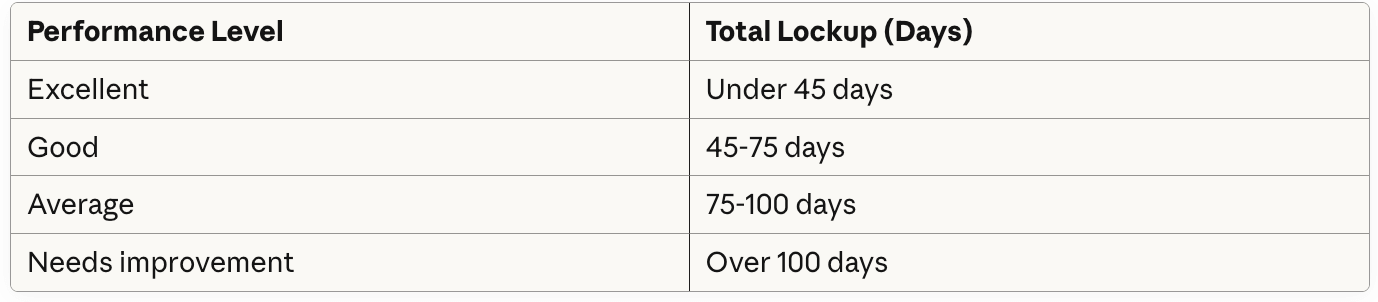
Cash Flow Benchmarks: Lockup
"Lockup" measures how many days your revenue sits unbilled or uncollected. It's the gap between doing work and getting paid.
Lockup Components
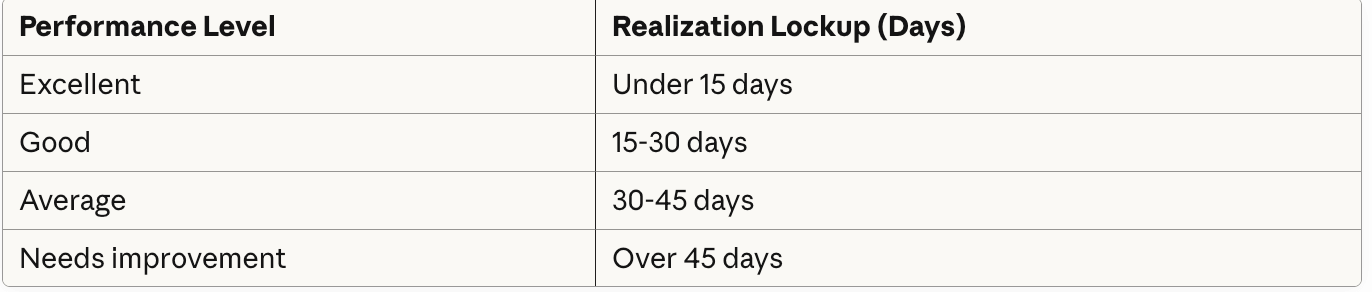
Realization lockup: Days between work performed and invoice sent
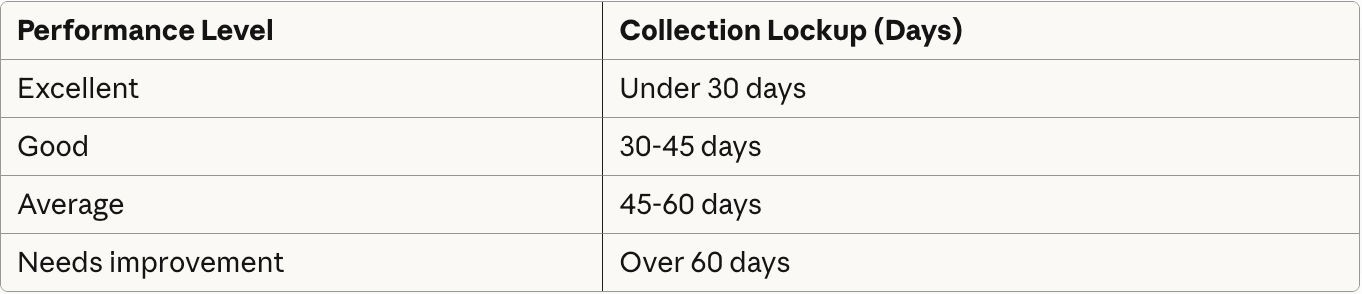
Collection lockup: Days between invoice sent and payment received
Total lockup: Combined days from work to payment
The cash flow impact: At $50,000 monthly revenue, 90-day lockup means $150,000 constantly tied up in unbilled work and unpaid invoices. Reducing to 45-day lockup frees $75,000 for operations or reserves.
The Trust Accounting Connection
Here's what benchmark articles miss: trust accounting provides early warning signals for several key metrics.
Retainer depletion rate signals realization problems. If clients burn through retainers faster than expected, you're either underpricing or facing scope creep - both hurt margins.
Trust-to-operating transfer timing directly affects lockup. Firms with disciplined three-way reconciliation and systematic fee transfers show lower total lockup than firms treating trust accounting as a quarterly compliance task.
Trust balance trends predict collection issues. Clients consistently depleting retainers without replenishment often become collection problems when work continues beyond trust funds.
This is why our Legal Ledger Protocol™ integrates trust accounting into management reporting. The same data supporting compliance also signals operational problems—but only if you're looking at it regularly rather than treating trust accounting as separate from firm finances.
How to Use These Benchmarks
Benchmarks only matter if you act on them. Here's a systematic approach.
Step 1: Calculate Your Current Position
Pull data from your practice management system and accounting software:
Utilization rate (billable hours ÷ available hours)
Realization rate (billed ÷ worked)
Collection rate (collected ÷ billed)
Profit margin (net income ÷ revenue)
Overhead ratio (overhead ÷ revenue)
Revenue per lawyer
Total lockup days
Step 2: Identify Gaps
Compare each metric to benchmarks. Flag anything:
Below "average" performance level
Declining from your own prior periods
Significantly below target for your firm size and practice area
Step 3: Prioritize Improvements
Not all gaps deserve equal attention. Focus on:
Highest impact: Utilization improvements multiply through realization and collection. A 5% utilization improvement often yields 10%+ revenue increase.
Lowest effort: Collection rate improvements often require only process changes - systematic follow-up, better payment options, clearer terms - rather than major investment.
Structural issues: Overhead ratio and profit margin problems may require larger changes - renegotiating rent, restructuring staffing, adjusting pricing - but address root causes rather than symptoms.
Step 4: Track Monthly
One-time benchmarking reveals current position. Monthly tracking reveals trends. Build a financial dashboard that surfaces these metrics automatically.
Benchmark Tracking Template
Use this framework for monthly review:
Track trend direction (improving, declining, stable) alongside absolute numbers. A 35% profit margin trending down demands attention even if it exceeds average.
When Benchmarks Don't Apply
Benchmarks describe typical performance, not optimal performance for your specific situation.
Practice area matters: Insurance defense margins at 20% may be excellent for that practice; the same margin in estate planning signals problems.
Growth stage matters: A firm investing heavily in marketing and hiring may show compressed margins temporarily while building capacity. That's different from structural inefficiency.
Strategic choice matters: A firm prioritizing attorney quality of life might accept lower utilization in exchange for reduced burnout and turnover. That's a valid trade-off if intentional.
Use benchmarks as diagnostic tools, not prescriptive mandates. They tell you where to investigate, not necessarily what to do.
Building Benchmark Visibility
Most firms lack systems to generate these metrics automatically. Proper bookkeeping infrastructure makes the difference between monthly clarity and quarterly guessing.
Your accounting system should track:
Revenue by practice area and attorney
Expenses categorized for overhead analysis
AR aging for collection tracking
Trust account integration for complete financial picture
Your practice management system should track:
Billable vs. non-billable time by attorney
Billed vs. worked hours by matter
Invoice aging and payment status
Without this infrastructure, you're extracting data manually - which means you're probably not doing it consistently. The investment in systems pays for itself in visibility alone, before considering the profit improvements that visibility enables.
Ready to View Your Metrics Like a Firm Scaling Through Data-Driven Decisions?
Our expertise in legal bookkeeping goes beyond just maintaining clean records - we empower you with financial control, bar compliance, and actionable insights. Regularly reviewing these metrics is crucial for assessing your firm's performance. This approach ensures your law firm's success in a competitive market.
Schedule a free 15-minute consultation:
👉 https://www.accountingatelier.com/law-firms
Frequently Asked Questions
-
The industry average utilization rate is 37%, representing about 2.9 billable hours per 8-hour day. Well-managed firms target 40-45% utilization. Larger firms (20+ employees) average 45% utilization, while solo practitioners average only 26% due to higher administrative burden.
-
Small law firms should target 35-45% profit margin. The industry median for firms with 1-10 attorneys is approximately 30%. Well-managed firms achieve 40%, and exceptional performers reach 50%. Margins below 25% typically indicate overhead problems or pricing issues that need investigation.
-
Divide total overhead expenses (all non-attorney costs including rent, staff salaries, technology, insurance, and administrative expenses) by total revenue. Industry average is 45-50%. Well-managed firms keep overhead at 40-45% of revenue.
-
Target 95% or higher. The industry average collection rate is 91%, meaning 9% of invoiced work goes uncollected. Small firms often outperform larger firms on collection due to closer client relationships and more direct follow-up on receivables.
-
Small firms should target 2-3× average attorney salary. With average lawyer salary around $176,000, healthy revenue per lawyer ranges from $400,000-$600,000. Below $350,000 typically indicates utilization or pricing problems.
-
Lockup measures the days between performing work and receiving payment. It includes realization lockup (work to invoice) and collection lockup (invoice to payment). Industry average total lockup is 75-100 days. Well-managed firms target under 45 days to optimize cash flow.
-
IUtilization rate multiplies with realization and collection rates to determine your effective billing rate. At industry averages (37% × 88% × 91%), only 29.6% of working time converts to collected revenue. Improving utilization from 37% to 45% increases effective rate by 22% - potentially adding $70,000+ per attorney annually.
-
Target 40-45% of revenue for overhead expenses. Industry average is 45-50%. Overhead exceeding 50% typically indicates inefficiency that compresses profit margins. Staff costs usually represent 40-50% of overhead, followed by rent/occupancy at 15-25%.
About the Author Written by Amy Coats, founder of Accounting Atelier. With over 20 years in financial management, Amy specializes in law firm bookkeeping and IOLTA compliance. She is a QuickBooks Online ProAdvisor, Clio Certified Consultant, and MyCase Partner - dedicated to helping solo attorneys and small firms build financially sound practices.