Law Firm Profitability: The Complete Guide to Measuring and Improving Your Margins
Updated April 2026
Law firm profitability measures what a firm keeps after all expenses, not what it bills or collects. The median profit margin for solo practitioners ranges from 25% to 40%, while small firms (2-10 attorneys) typically fall between 28% and 38%, according to ABA data and industry surveys. The gap between revenue and profit comes down to three compounding rates: utilization (how much time gets billed), realization (how much billed time reaches invoices), and collection (how much invoiced work converts to cash). The median firm loses 70% of its available attorney time before a single expense gets subtracted.
A personal injury firm billing $1.2 million sat down with us last year to figure out why they couldn't make payroll in March despite having their "best year ever." The answer was in their numbers - they just couldn't see it.
Their overall profit margin looked healthy at 28%. But when we broke it down by practice area, their PI contingency work showed 42% margins while their "side business" of general civil litigation ran at 8%. They were subsidizing losing work with winning work and had no idea.
That's the difference between tracking revenue and understanding profitability. One tells you money came in. The other tells you whether you're building wealth or just staying busy.
What Is Law Firm Profitability?
Profitability measures what your firm keeps after expenses - not what it bills or collects.
Profit = Revenue - All Expenses
Profit Margin = (Profit ÷ Revenue) × 100
The formula is simple. Getting the inputs right is where firms get stuck. Because "all expenses" includes items most firms don't track correctly, and "revenue" requires clarity about when money is actually earned versus when it hits your bank account.
A firm collecting $800,000 annually with $520,000 in total expenses generates $280,000 in profit - a 35% margin. That 35% funds partner draws, reserves, and growth investment.
But firm-level calculations hide the details that drive strategic decisions. Your 35% margin might come entirely from two practice areas while a third loses money. One partner might generate 70% of profits while others consume resources without proportional return.
Real profitability analysis requires drilling past the top line into practice areas, matters, and individual performance.
What Are Typical Law Firm Profit Margins?
Most "benchmark" articles throw out ranges without sources. Here's what the actual data says.
The Clio Baseline (2024 Legal Trends Report):
The fundamental math of law firm profitability starts with how attorneys spend their time:

Source: Clio 2024 Legal Trends Report
Those three rates compound. The average attorney works an 8-hour day but only bills 2.9 hours. Of that, only 88% makes it to an invoice. Of invoiced work, only 91% gets collected.
The math: 2.9 billable hours × 88% realization × 91% collection = 2.3 hours of collected revenue per 8-hour day.
That's a 29% effective rate on attorney time before you subtract any expenses.
Utilization Rate by Firm Size (2024):

Source: Clio 2024 Legal Trends Report
Larger firms aren't more profitable because their attorneys work harder. They're more profitable because they've built systems that protect billable time from administrative drain.
Profit Margins by Firm Size:
According to ABA data and industry surveys, median profit margins break down roughly as follows:
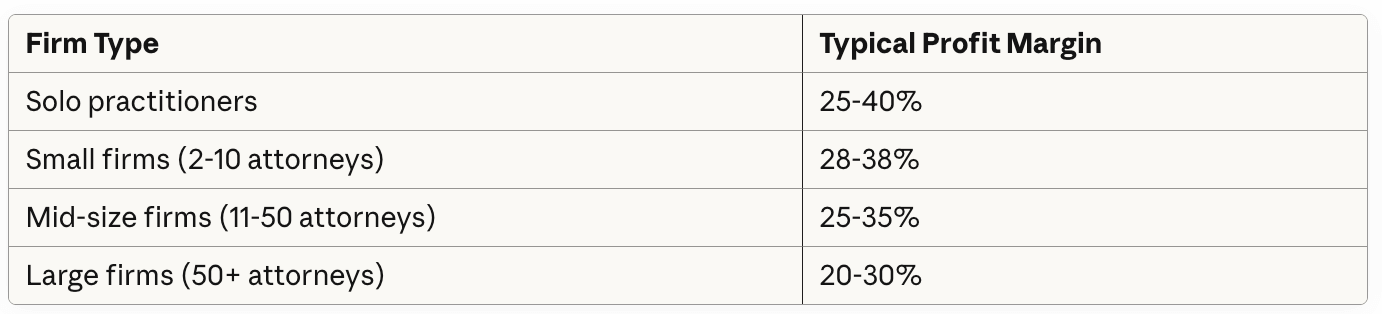
Source: ABA and industry surveys
Solo practitioners can achieve higher margins because they carry minimal overhead and take no profit-sharing dilution. But the data hides a critical nuance: solo attorneys spend only 55% of their day on billable work versus 69% for attorneys at firms with 11+ lawyers (ABA). That non-billable administrative burden caps their revenue ceiling even when margins look strong.
Profit Margins by Practice Area:
Practice area dramatically affects margin potential:
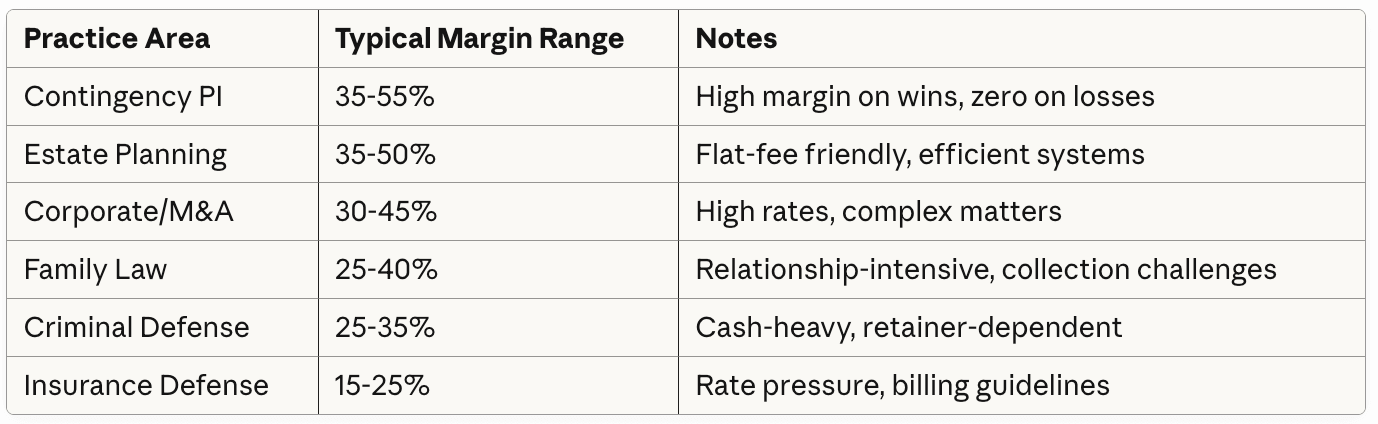
Industry benchmarks; contingency margins reflect settled cases only
The contingency number requires context. A 45% margin on settled cases means nothing if 30% of cases settle. Effective margin accounts for the fully-loaded cost of matters that return zero.
What Is Realization Rate and Why Does It Matter More Than Billable Hours?
Realization rate measures the percentage of billable time that actually appears on invoices. An attorney who logs 100 billable hours at $300/hour but only invoices $26,400 has an 88% realization rate. That missing 12% represents $3,600 in work performed but never billed.
The industry average sits at 88% according to the 2024 Clio Legal Trends Report. Top-performing firms hit 95% or higher.
That 7-point gap is worth more than most firms realize. On $500,000 in billable work:
88% realization = $440,000 invoiced
95% realization = $475,000 invoiced
Difference: $35,000 in recovered revenue with zero additional work
Realization drops for predictable reasons. Attorneys write off time they feel was excessive. Partners discount invoices before sending them. Timekeepers forget to log entries and reconstruct hours days later, then trim what they can't remember clearly. Flat-fee matters that run over budget absorb the overage as invisible write-offs.
How to track it:
Pull this from your practice management system monthly. Clio, MyCase, and PracticePanther all report realization by attorney and by matter type. In QuickBooks, compare total time entries against invoiced amounts for the same period.
Track at three levels:
Firm-wide realization: Your overall percentage. Below 85% signals a systemic problem.
Attorney-level realization: Identifies who writes off the most and why. One attorney at 78% while others are at 92% is a coaching conversation, not a billing policy problem.
Matter-type realization: Flat-fee work almost always has lower realization than hourly. That's expected. But if a specific matter type consistently falls below 80%, you're underpricing it.
The fix isn't "bill more hours." The fix is closing the gap between work performed and work invoiced. That means contemporaneous time entry (same-day, not end-of-week reconstruction), clear write-off approval processes, and regular review of flat-fee pricing against actual time invested.
How Do You Calculate Law Firm Profitability?
Most firms calculate profitability incorrectly. Here's the methodology that produces actionable numbers.
Step 1: Establish True Revenue
Revenue should reflect earned income. For accrual-basis firms, recognize revenue when work is performed. For cash-basis firms, track both collected revenue and outstanding AR to understand economic reality.
Include:
Legal fees (hourly, flat-fee, contingency)
Earned portions of retainers
Recovered costs billed to clients
Exclude:
Unearned retainers still held in trust
Client cost advances (pass-throughs)
Trust account activity
Getting this wrong overstates or understates your true economic position by thousands.
Step 2: Capture All Expenses
Direct expenses:
Attorney compensation (salary, draws, benefits)
Paralegal and staff compensation
Bar dues, CLE, malpractice insurance
Overhead expenses:
Rent and utilities
Technology (practice management, research, accounting)
Marketing and business development
Administrative staff
Professional services (bookkeeping, accounting, IT)
Insurance (general liability, cyber)
Commonly missed expenses:
Partner health insurance paid personally
Home office costs for remote attorneys
Technology subscriptions on personal cards
Meals and travel buried in personal accounts
Continuing education paid outside firm
Expense leakage averages 5-12% of true overhead in firms without rigorous tracking. That leakage comes directly off your profit margin.
Step 3: Calculate Firm-Level Margin
Net Profit = Total Revenue - Total Expenses
Profit Margin = Net Profit ÷ Total Revenue
Run this monthly. Track trailing 12-month trends to smooth seasonal variation. A single month tells you nothing; directional movement over quarters tells you everything.
Step 4: Break Down by Practice Area
Firm-level margin hides practice area performance. For each practice area, calculate:
Revenue generated
Direct costs (attorney time at loaded cost, paralegal time, matter-specific expenses)
Allocated overhead (proportional share of rent, admin, technology)
Practice area profit margin
This analysis routinely reveals that the "biggest" practice area by revenue generates the smallest margin. Smaller areas often deliver superior returns per dollar invested.
Without this breakdown, you can't make informed decisions about where to grow, where to invest, and what to exit.
Step 5: Connect Trust Accounting to Profitability
Here's what most firms miss - and what separates struggling practices from profitable ones.
Trust accounting isn't just a compliance function. It's a profitability signal.
Trust activity reveals:
Cash flow timing: When retainers convert to earned revenue affects your operating cash position. Firms that don't integrate trust-to-operating transfers into cash flow planning face unnecessary crunches.
Client payment behavior: Retainer depletion rates and replenishment patterns predict collection problems before they hit AR aging.
Matter profitability signals: Matters burning through retainer faster than expected indicate scope creep or underpricing - both profit killers.
Compliance as canary: Trust accounting errors correlate with broader financial management problems. Firms struggling with three-way reconciliation typically have deeper operational issues affecting profitability.
Trust accounting violations remain among the top causes of attorney discipline nationally. In Florida's 2024 discipline statistics, trust accounting issues ranked in the top three complaint categories. The firms facing these problems rarely have isolated trust issues—they have systemic financial management breakdowns.
This is exactly why our Legal Ledger Protocol™ integrates trust accounting into overall financial management rather than treating it as a separate compliance checkbox. When trust data flows into your management reporting, you see problems before they become violations - and before they drain profit.
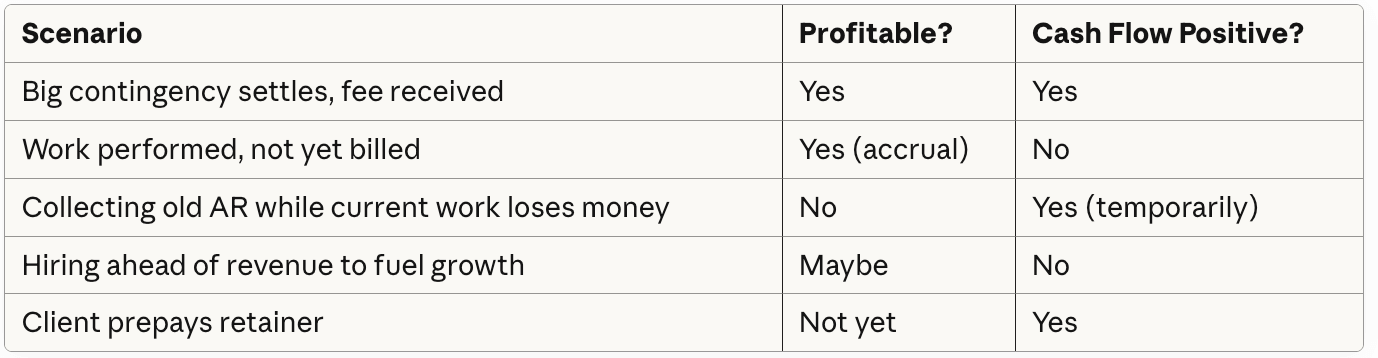
What Is the Difference Between Law Firm Cash Flow and Profitability?
Law firm cash flow and profitability are related but distinct. Confusing them leads to decisions that damage one while optimizing for the other.
Profitability = Economic performance over time. Revenue minus expenses.
Cash flow = Money movement. When cash arrives and leaves your accounts.
A firm can be profitable but cash-poor. A firm can have strong cash flow while bleeding profit.
The cash flow trap:
Firms that manage to P&L alone often miss cash crunches until they hit. Firms that manage to cash flow alone often miss profitability erosion until it's critical.
Manage both. Track profit margin monthly. Track AR aging weekly. Build cash reserves equal to 60-90 days of operating expenses. Make partner distributions based on actual cash available, not paper profit.
What Kills Law Firm Profitability?
Profit margin problems trace to a handful of recurring issues. These problems run undetected until someone pulls the actual numbers.
1. The Utilization Gap
The problem: Your attorneys bill 2.9 hours per 8-hour day (industry average). The other 5+ hours go to administration, marketing, firm management, and unbillable client service.
The cost: Every unbillable hour at a $300/hour rate represents $300 in theoretical lost revenue. At 5 hours per day, that's $1,500 daily, $7,500 weekly, $390,000 annually - per attorney.
The fix: Audit where non-billable time actually goes. Outsource administrative functions where the cost is lower than attorney hourly rates. Invest in systems that protect billable time. Target 45%+ utilization - moving from 37% to 45% utilization represents a 22% increase in billable capacity.
2. Realization Rate Erosion
The problem: Not all billable time makes it to invoices. Write-offs, write-downs, missed entries, and "courtesy" discounts erode revenue before you even try to collect.
The cost: The gap between 88% realization (average) and 95% realization (top performers) on $500K of billable work is $35,000 in lost revenue annually.
The fix: Track realization at the matter and attorney level. Investigate matters falling below 90%. Address chronic discounting - if you're always discounting, your rates are wrong or your scope management is broken.
3. Collection Failures
The problem: 91% average collection means 9% of invoiced work never converts to cash. On $500K invoiced, that's $45,000 left on the table.
The cost: AR over 90 days has significantly lower collection probability. Every dollar stuck in aging AR is a dollar not funding operations or profit.
The fix: Monitor AR aging weekly. Implement systematic follow-up at 30, 45, 60 days. Consider retainer requirements for clients with collection history. Bill promptly - delays in billing correlate with collection problems.
4. Invisible Practice Area Losses
The problem: Firms track total revenue without practice area profitability. Resources flow to revenue-generating areas without considering margin.
The cost: A practice area generating $400K revenue at 12% margin contributes $48K profit. One generating $200K at 40% margin contributes $80K. Without visibility, you'd invest in the wrong one.
The fix: Configure your chart of accounts for practice area tracking. Run practice-area P&Ls monthly. Let data guide resource allocation, not revenue assumptions.
5. Wrong Staffing Leverage
The problem: Partners doing work associates or paralegals could handle at lower cost. Or matters staffed too lean, creating quality issues requiring expensive rework.
The cost: A partner at $400/hour doing work a $150/hour associate could handle doesn't just reduce profit - it constrains firm capacity and often reduces margin when clients resist partner rates for routine tasks.
The fix: Audit matter staffing quarterly. Create role-appropriate task guidelines. Invest in training that allows appropriate delegation with quality oversight.
6. Overhead Creep
The problem: Expenses increase incrementally without corresponding revenue growth. Software subscriptions, office expansion, additional staff - each justified individually, collectively compressing margin.
The cost: Overhead growing at 8% while revenue grows at 4% destroys margin within years.
The fix: Review all recurring expenses annually. Benchmark each category as percentage of revenue. Question anything growing faster than revenue. Kill underutilized subscriptions and services.
7. Siloed Financial Data
The problem:Trust accounting operates separately from firm finances. Billing doesn't integrate with accounting. Practice management lives in its own system. Partners make decisions without complete picture.
The cost: Missed cash flow insights, disconnected reporting, compliance data not leveraged for management, and inefficient reconciliation processes consuming hours monthly.
The fix: Integrate practice management, billing, trust accounting, and firm accounting. Use connected systems or proper integration. Run financial reports that synthesize all sources. The Legal Ledger Protocol™ exists specifically to create this integration for law firms - trust compliance and financial management as unified function, not separate silos.
How Do You Build a Law Firm Profitability Improvement Plan?
Profitability improvement requires systematic effort, not occasional attention.
Months 1-3: Establish Visibility
Configure accounting for practice area tracking
Calculate current margins (firm-level and by practice area)
Establish baseline metrics (utilization, realization, collection)
Implement monthly financial review discipline
Months 4-6: Address Obvious Drains
Fix realization and collection rate problems
Review and cut unnecessary overhead
Identify unprofitable clients and matters
Adjust pricing where margins don't support the work
Months 7-12: Optimize Structure
Refine leverage model for appropriate staffing
Invest in high-margin practice areas
Consider exiting persistent low-margin work
Build cash reserves (60-90 days operating expenses)
Ongoing: Maintain Discipline
Monthly financial review with action items
Quarterly profitability analysis by practice area
Annual overhead audit and benchmarking
Weekly cash flow and AR aging monitoring
The Infrastructure Investment
You can't improve what you don't measure. Most law firm profitability problems persist because firms lack systems to see them.
The difference between firms building wealth and firms staying busy often comes down to financial infrastructure: proper bookkeeping that captures the right data, accounting configured for law firm analysis, trust accounting integrated with management reporting, and partners who actually review the numbers.
Building this infrastructure has costs. Professional bookkeeping runs $500-2,000+ monthly depending on complexity. Practice management software runs $50-150 per user monthly. Integration and setup requires upfront investment.
But operating without visibility costs more. Strategic decisions made on incomplete data. Problems compounding for months before detection. Profit leaking through gaps no one monitors.
Profitable firms treat financial management as strategic infrastructure - not administrative overhead.
If you want to see where your firm's margins actually stand, that conversation starts here.
Frequently Asked Questions
-
A good profit margin for a law firm depends on size and structure. Solo practitioners typically achieve 25% to 40% margins because they carry minimal overhead and take no profit share from other attorneys. Small firms with 2 to 10 attorneys average 28% to 38%. Mid-size firms fall between 25% and 35%, and large firms between 20% and 30%. These figures come from ABA data and industry surveys. Practice area also matters: contingency personal injury work can reach 35% to 55% on settled cases, while criminal defense and family law tend to run 20% to 35%. A firm consistently below 20% likely has structural issues with utilization, realization, or overhead allocation.
-
Calculate law firm profitability by subtracting all expenses from total revenue. Net Profit equals Total Revenue minus Total Expenses. Profit Margin equals Net Profit divided by Total Revenue, multiplied by 100. Revenue should reflect earned income only, excluding unearned retainers held in trust and client cost advances. Expenses include attorney and staff compensation, rent, technology, insurance, marketing, and commonly missed items like partner health insurance paid personally, CLE costs on personal cards, and home office expenses. Run this calculation monthly and track trailing 12-month trends to smooth seasonal variation.
-
Profitability measures economic performance over time: revenue minus expenses. Cash flow measures money movement: when cash arrives and when it leaves your accounts. A firm can be profitable on paper but cash-poor if clients pay slowly. A firm can have strong cash flow from retainer deposits while bleeding profit from high overhead. The distinction matters because managing only to the P&L misses cash crunches, and managing only to cash flow misses margin erosion. Track profit margin monthly and AR aging weekly. Build cash reserves equal to 60 to 90 days of operating expenses.
-
Three metrics compound to determine law firm profitability: utilization rate, realization rate, and collection rate. Utilization rate measures billable hours as a percentage of total hours worked. The industry average is 37%, meaning attorneys bill 2.9 hours of an 8-hour day (2024 Clio Legal Trends Report). Realization rate measures how much billable time reaches invoices, averaging 88%. Collection rate measures how much invoiced work converts to cash, averaging 91%. These compound: 2.9 billable hours multiplied by 88% realization multiplied by 91% collection equals 2.3 hours of collected revenue per 8-hour day. Improving any one of these rates has an outsized effect on the bottom line.
-
Larger law firms carry higher fixed overhead, including office leases, administrative staff layers, technology infrastructure, and equity partner compensation structures with profit-sharing arrangements. They also face higher per-attorney costs for malpractice insurance, benefits, and business development. However, larger firms generally achieve higher utilization rates (45% vs. 26% for solos, according to Clio data) and higher absolute revenue. Their lower margin percentages often produce higher total profit dollars. Solo practitioners achieve higher margins because they avoid profit-sharing and carry minimal overhead, but their total revenue is capped by one person's billable capacity.
-
Trust accounting directly affects law firm profitability in four ways. First, the timing of retainer-to-earned-revenue conversion affects operating cash position and when income appears on financial statements. Second, retainer depletion rates and replenishment patterns predict collection problems before they show up in accounts receivable. Third, matters burning through retainers faster than expected indicate scope creep or underpricing, both of which cut into margins. Fourth, trust accounting errors correlate with broader financial management problems. Firms struggling with three-way reconciliation typically have gaps in their general accounting as well. Trust accounting violations remain among the top causes of attorney discipline nationally.
-
Law firms should analyze profitability monthly at the firm level and quarterly by practice area. Monthly firm-level analysis tracks overall margin trends and catches problems early. Quarterly practice-area breakdowns reveal which areas generate the highest margins versus which generate revenue but contribute little profit. Weekly monitoring should cover cash flow and AR aging. Annual reviews should include a full overhead audit and benchmarking against industry data. Track trailing 12-month trends rather than relying on single-month snapshots, which can be distorted by seasonal billing patterns or large case resolutions.
-
The most common causes of low law firm profit margins are low utilization rates, realization rate decline, collection failures, invisible practice area losses, wrong staffing leverage, overhead creep, and siloed financial data. Low utilization means attorneys spend too many hours on non-billable administrative work. Realization declines happen through write-offs, write-downs, and missed time entries. Collection failures leave 9% of invoiced work unconverted to cash at the industry average. Practice area losses hide when firms track only total revenue without calculating margins per area. Overhead creep occurs when expenses grow faster than revenue without anyone noticing because no one is benchmarking categories against income.